Map Colouriser
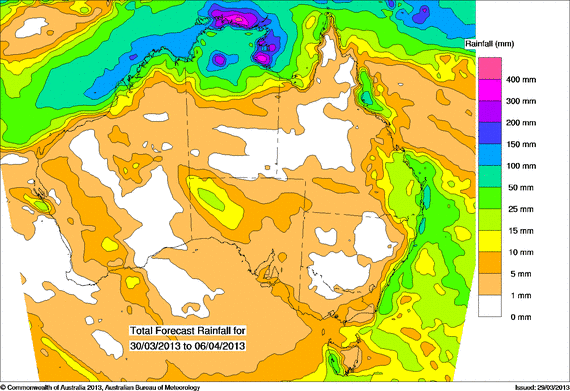
Map Colouriser can help colour blind users in reading maps, seating plans and other content where colour is used to convey information.
Geography teachers can use Map Colouriser to make Choropleth maps accessible to colour blind students.
Map Colouriser is available in two versions:
- Online tool
- Webmaster script
Demo
Hover over the legend to see the map change. Alternatively, move focus to the map and then use the Arrow keys.

Map Colouriser - online tool
Step 1 of 2: Paste or drag an image to the box. Alternatively, upload a file.
How to use online tool
Once you've dragged an image file to the box above, click on each of the colours in the legend, then hover the mouse over a legend item to see the corresponding colour turn black on the map. Alternatively, move focus to the map then use the Arrow keys to select a legend item.
Clicking on a legend item (or pressing the Enter key when it has focus) will freeze the map in this view so you can move the mouse without changing the view. This can help screen magnifier users as they use the mouse to navigate the screen. It also comes in handy for keyboard users as they can use the Arrow keys to scroll the page when the map is frozen.
Hovering over a legend and pressing the delete key removes the legend.
| Key | Function |
|---|---|
| Arrow | Move between legends |
| Enter | Freeze current legend |
| Delete | Remove current legend |
| Escape | Unselect current legend |
| B | Toggle black and white mode |
Locking the map
Clicking the lock button removes the ability to create new legends, so you can click around on the map as you wish.
Changing tolerance
The drop-down box can be used to change the colour tolerance. If the legend colour is different from the colour on the map it might be necessary to use a greater tolerance e.g. change the drop-down from 20 to 50 and then clicking to create a new legend.
Colour name
Clicking the N icon displays a panel below the image with information about the pixel that is moused over:
- Colour description e.g. "Dark grey red"
- Colour name if the values are close e.g. "Auburn"
- Hue, saturation and lightness values
The colour names are from the colour listing on Wikipedia .
Keyboard mode
Clicking the keyboard icon displays a yellow circle in centre of the map. The circle can be moved using the keyboard Arrow keys and pressing Enter created a legend item on the map. This enables keyboard users to create legend items.
| Key | Function |
|---|---|
| Arrow | Move yellow circle one tenth of the map |
| Alt + Arrow | Move yellow circle 1 pixel |
| Shift + Arrow | Scroll webpage |
| Enter | Create a legend under yellow circle |
| C | Place yellow circle in the centre of the map and reset bisecting navigation |
| Ctrl + Arrow | Move yellow circle in bisecting distances: for each move the distance is halved |
| Escape | Exit keyboard mode |
Black and white mode
This mode shows all legend pixels as black and all other pixels as white.
Tip: use the Down and Up arrow keys to cycle through legends and use the B key to toggle between standard view and black and white view.
Show legends
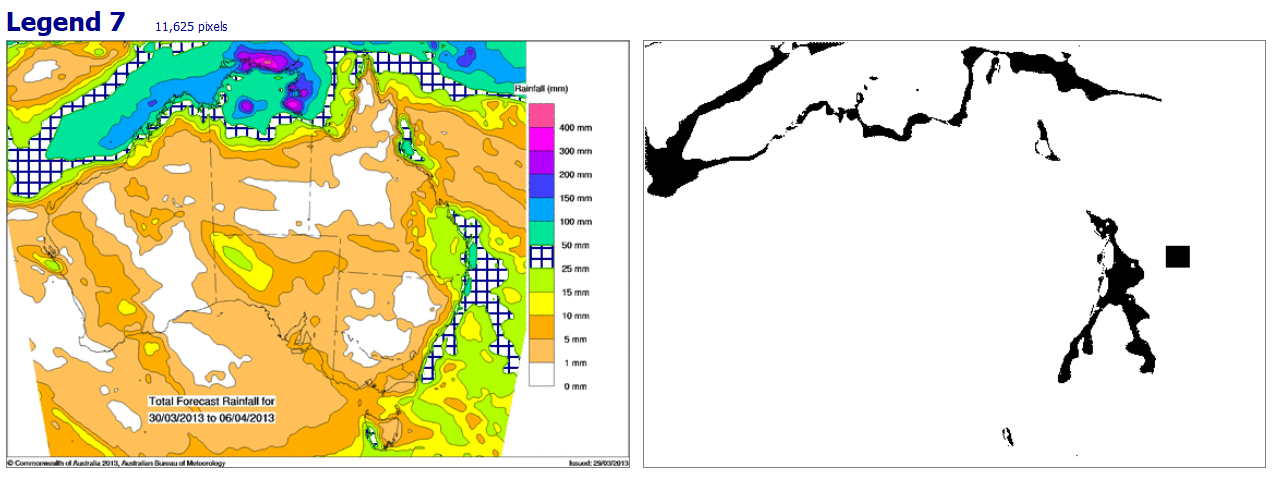
The Show legends function creates a web page with images of the legends. This can be printed if a hardcopy is needed (you can print as PDF from browser).
It can take a while to generate the print version. For large image files you might have to do one legend at the time and then combine the PDF documents or paste into a Word document.
The print version includes 2 images for each legend. The first image shows the selected colour as a grid, the second image shows the selected colour as black pixels on a white background.

Map Colouriser - webmaster script
The Map Colouriser functionality can be added to any image by including a call to the Map Colouriser function. On pageload, the image is swapped with a canvas element with built-in Map Colouriser functions. This is shown in the demo at the top of the page.
Note: the webmaster version does not allow users to create or delete legend items.
Here you can get the Map Colouriser webmaster script.
Code for making an image a Map Colouriser:
The arguments to the addMap Colouriser function are:
- id of the image
- Number between 0 and 100. 0 means that only the exact pixel colour will be recognised, higher numbers allow for variation in the colour.
- Array of points. Each point represents a pixel within a legend colour. You can get these numbers by opening the image in Microsoft Paint and hover the mouse over a legend area, the x and y-values are displayed in lower left section of the window. Any point within the coloured legend area will usually do.
Terms of Use
This software is being provided "as is", without any express or implied warranty. In particular, me2 Accessibility does not make any representation or warranty of any kind concerning the reliability, quality, or merchantability of this software or its fitness for any particular purpose. additionally, me2 Accessibility does not guarantee that use of this software will ensure the accessibility of your web content or that your web content will comply with any specific web accessibility standard.

This work is licensed under a
Creative Commons License

